
How to Map a Funnel in 20 Minutes (and Find Where It Leaks)
Some links below are affiliate links: if you buy through them we may earn a commission at no extra cost to you. It funds the testing budget and never changes a verdict — affiliate policy.
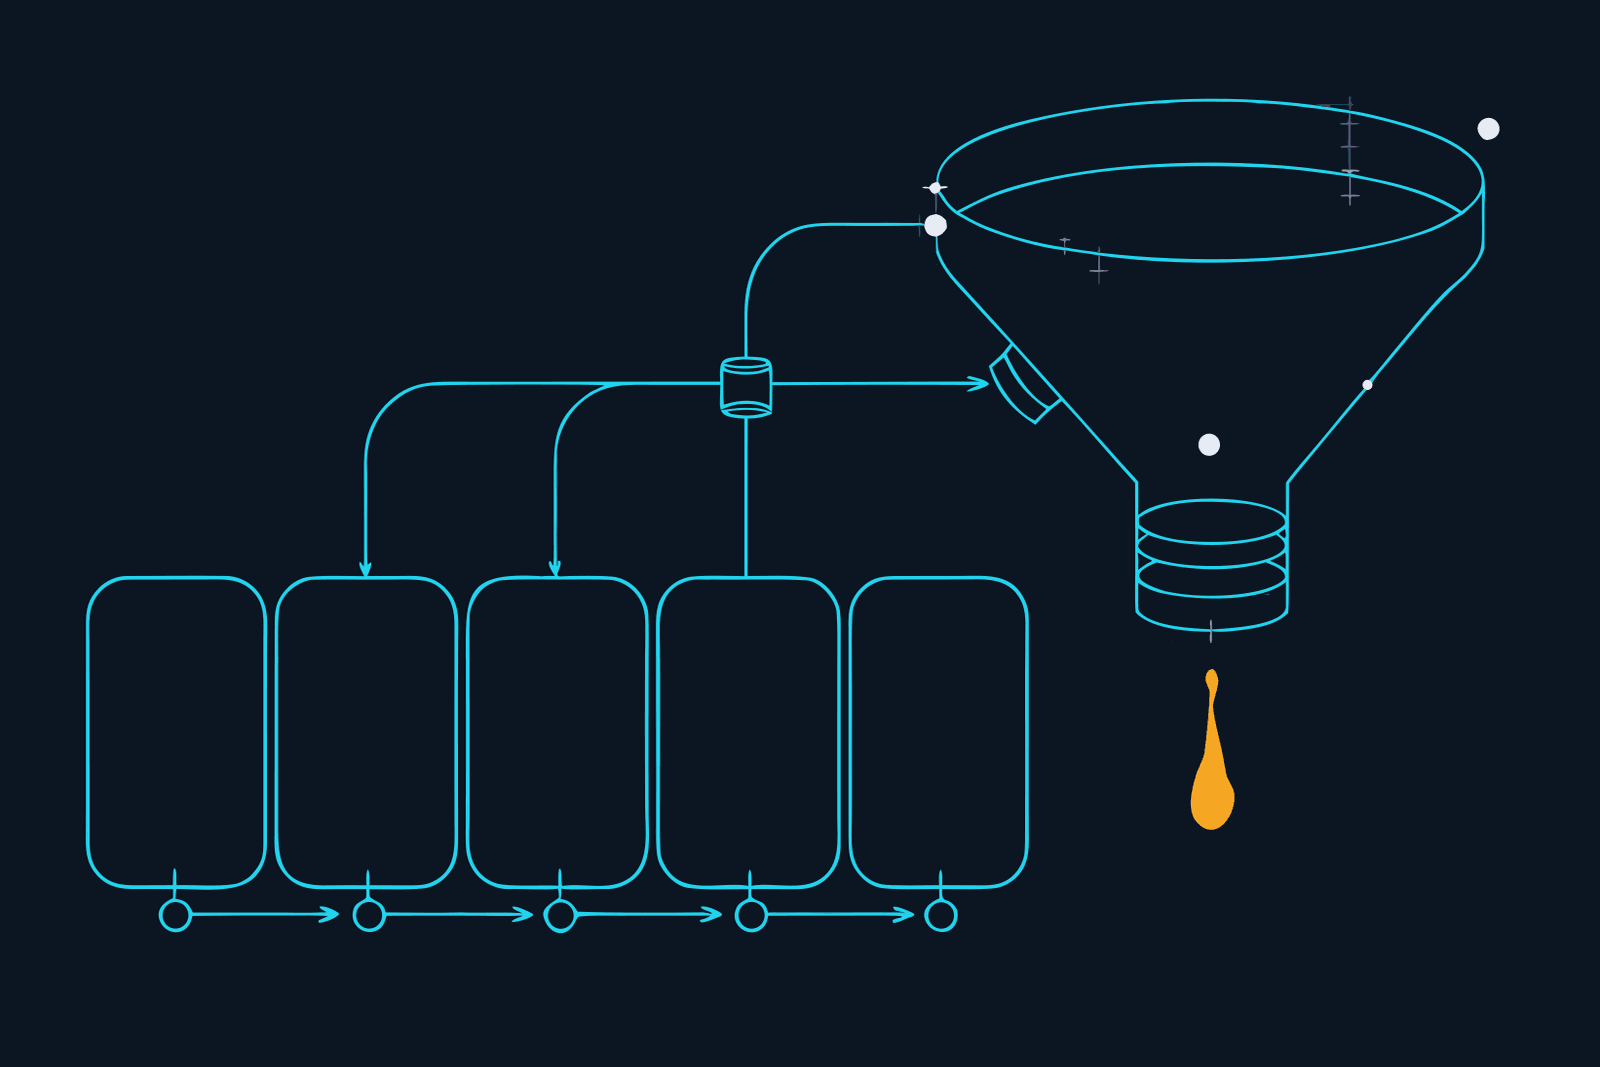
Funnel mapping sounds like a job for a strategist with a big whiteboard. It isn't. A funnel map is a drawing of every step between a stranger and a sale, with a number on every arrow. You can make one in twenty minutes with a pen, and it will tell you more about why your funnel underperforms than a week of tweaking button colors.
This guide gives you the tool-neutral recipe first. Then it covers when a dedicated funnel mapping tool is worth the money, and when it is not.
What funnel mapping is (and what it isn't)
A funnel map answers two questions:
- How is this funnel built? Every source, page, action and follow-up, in order, with arrows between them.
- Where does it lose people? A conversion rate on every arrow, so you can see which step does the most damage.
Most people only do the first half. They draw a pretty flowchart, show it to a client or a partner, and never look at it again. The drawing is useful for agreeing on what to build. The numbers are what make it useful after launch.
What a funnel map is not: a replacement for your page builder, your email tool or your analytics. It sits on top of them. You plan on the map, build in your tools, then bring the numbers back to the map.
The four boxes every funnel is made of
Forget "awareness, interest, desire, action" for a moment. Those stages are fine for strategy decks, but you cannot draw them. For a map, you need four concrete types of box:
- Traffic source. Where people come from. An Instagram post, a Google search, a newsletter mention, a paid ad, a podcast appearance. Be specific: "LinkedIn post" is a box, "social media" is not.
- Page. Where they land. The opt-in page, the thank-you page, the sales page, the checkout, the booking page.
- Action. What they do on that page. Opt in, click to the offer, book a call, buy. One action per page. If a page asks for two things, that is usually the first leak.
- Follow-up. What brings people back after they leave. The welcome sequence, a reminder email, a retargeting ad, a sales call.
Every funnel you will ever build is a chain of those four. A lead magnet funnel is source, opt-in page, opt-in, thank-you page, welcome sequence, sales page, purchase. A webinar funnel adds a registration page, reminder emails and a replay. An affiliate funnel, like the one in our guide to building a funnel for affiliate marketing, ends with a click to someone else's checkout instead of your own.
The 20-minute funnel map
Pick one funnel. Not your whole business, one path to one offer. Then set a timer.
- List your traffic sources (3 minutes). Write every place people currently come from, one per box, on the left of the page. If you do not know, open your analytics and look at the top referrers for the landing page. Only include sources that actually send people today.
- Draw the pages (4 minutes). Put each page in a box, left to right, in the order a visitor meets them. Include the boring ones: the thank-you page and the checkout are pages too, and they leak like any other.
- Write the action under each page (2 minutes). One verb per page: "opts in", "clicks to offer", "buys". If you cannot name the single action a page wants, write down the two it asks for and circle it. That page needs work.
- Add the follow-up (3 minutes). Draw the emails, reminders and retargeting below the main path, with arrows back into it. Most maps show the welcome sequence as one box. Draw each email that contains a link to the offer as its own box: those are separate chances to convert.
- Connect everything with arrows (2 minutes). Every arrow is a decision a person makes. If there is a box with no arrow in or out, you have found a dead end or an orphan page.
- Write an expected conversion rate on every arrow (4 minutes). Your own guess, or your real number if you have one. Mark guesses with a question mark. More on this below.
- Circle the weakest arrow (2 minutes). That is the step you fix first.
That is the whole method. Paper works. So does a free whiteboard: Miro gives you three editable boards on its free plan and diagrams.net is free with no board limit (both checked September 2026). Use whatever you will actually open again next month.
Adding conversion rates: how the map finds the leak
A map without numbers is a diagram. A map with numbers is a diagnosis.
On every arrow, write the share of people you expect to take that step. If you are building a new funnel, these are assumptions. If the funnel is live, pull the real numbers from your analytics, your email tool and your checkout.
Then multiply along the path. Here is a made-up example to show the arithmetic, not a benchmark:
- 1,000 people visit the opt-in page.
- 30% opt in: 300 subscribers.
- 40% of those click through to the offer from the thank-you page or the emails: 120 people on the sales page.
- 2% of sales page visitors buy: about 2 sales.
Now look at each arrow and ask two questions.
Which arrow is furthest below what you expected? If you planned for 5% on the sales page and got 2%, the sales page is the leak, even if the opt-in rate "looks low" in isolation. Always compare against your own expectation for that step, not against a number you saw in someone's screenshot.
Which fix is worth the most? Improvements closer to the money usually pay more, because they apply to people who already cleared every earlier step. In the example, getting the sales page from 2% to 4% doubles sales without a single extra visitor. Getting the opt-in page from 30% to 33% adds 10% more people at the top, who then still have to get through the weak sales page.
Two rules keep this honest:
- Fix one arrow at a time. Change the sales page and the email sequence in the same week and you will never know which one worked.
- Do not add traffic to a leaking funnel. More visitors into a broken step just produces more of the same drop-off at a higher cost. This is the most expensive mistake on the map, and the numbers make it obvious.
Common leaks the map exposes
You will not know your numbers until you draw them, but some leaks show up on the map before any data arrives. Look for these:
- A page with two actions. An opt-in page that also asks people to follow you on social, or a sales page with three different buttons. Two actions on one page usually means fewer of both.
- A missing follow-up. An arrow that leaves the funnel with nothing bringing people back. Almost everyone who opts in does not buy on the thank-you page; if there is no sequence behind it, the map shows the gap in red. Our minimum viable funnel is built around closing exactly this gap with four pages and one sequence.
- A dead-end thank-you page. "Thanks, check your inbox" and nothing else. That page gets more attention than almost any other in the funnel. Put the next step on it.
- A traffic source that does not match the page. A cold Instagram audience landing on a page written for people who already know you. Draw separate arrows per source and you will often see that one source converts and another quietly does not.
- Orphans. Pages or emails that nothing links to. They are costing you effort and delivering nothing.
What to do with the map once it exists
A map that lives in a drawer is a waste of twenty minutes. Put it to work:
- Pick the one fix. The circled arrow from step 7. Write down what you will change and what number you expect it to reach.
- Set a date to check. Give the change enough traffic to mean something, then compare the real rate against the number on the map. A calendar reminder is enough.
- Update the map, not just the funnel. When you change a page or add an email, redraw the box. The map is only useful while it matches reality.
- Use it to say no. Every new idea (another lead magnet, a webinar, a second offer) has to earn a place on the map. If you cannot draw where it fits and what arrow it improves, it waits.
- Share it. A map is the fastest way to explain a funnel to a freelancer, a client or a partner. It replaces a page of written instructions.
If you want to see what finished maps look like for different business models, our collection of real-world Funnelytics examples walks through several.
When a dedicated funnel mapping tool pays off
For a single funnel you check once a month, a free whiteboard does the job. A dedicated funnel mapper starts paying for itself in three situations:
You present funnels to clients. Funnel-specific icons, templates and a clean canvas make a map look like a plan instead of a sketch. This matters more than it should when someone else is paying.
You want to forecast before you spend. A funnel mapper that lets you type in traffic, conversion rates and prices per step turns the arithmetic above into a live model. Change one rate and see the revenue move. That is how you decide whether an ad budget can work before you spend it.
You want the real numbers on the map. This is the big one. Instead of copying numbers from analytics into your drawing, a tracking script feeds real visitor flow into each box. The map becomes the dashboard.
Funnelytics is the tool built for all three, and it is the one we use. As of September 2026 its pricing page lists Map Pro at $39/month after a 7-day trial (unlimited canvases, collaborators and 100+ funnel templates) and Performance Pro at $129/month after a 14-day trial, which adds automatic tracking of sources, pages and buttons across domains plus bottleneck analysis and data-versus-forecast comparison. There is no longer a free plan. Our full Funnelytics review covers what you get at each tier and who should skip it.
If you only need one of those jobs, a cheaper route may fit better. Our comparison of the best funnel mapping tools lines up six options, from free whiteboards to forecast-only simulators, with the limits of each free plan.
A simple rule of thumb: draw your first two or three maps for free. If you catch yourself copying numbers into the drawing every week, or rebuilding the same map for a client presentation, that is the signal that a dedicated funnel mapper will save you more time than it costs.
The short version
- A funnel map is boxes (source, page, action, follow-up) connected by arrows, with a conversion rate on every arrow.
- Twenty minutes and a pen are enough for the first one.
- The weakest arrow compared with your own expectation is the leak. Fix that one step before adding traffic or pages.
- Keep the map updated, and use it to decide what not to build.
- Pay for a dedicated tool when you present, forecast or want live numbers on the map. Until then, a free whiteboard is the right tool.
Questions we actually get
What is funnel mapping?→
Funnel mapping is drawing every step a person takes from first contact to purchase (the traffic source, the pages, the actions and the follow-up emails) as boxes and arrows, then adding a conversion rate to each arrow. The drawing shows how the funnel is built; the numbers show where it loses people.
What are the stages of a marketing funnel map?→
For mapping, use four types of box instead of abstract stages: traffic source (where people come from), page (where they land), action (what they do there: opt in, book, buy) and follow-up (the email, retargeting or call that brings them back). Every funnel, from a lead magnet to a webinar, is a chain of those four.
What is the best funnel mapping tool?→
For a first map, whatever you already have: paper, Miro's free plan (3 editable boards) or the free diagrams.net. Funnelytics is the dedicated option: Map Pro costs $39/month after a 7-day trial and tracking starts at $129/month on Performance Pro (checked September 2026). Our funnel mapping tools comparison covers six options.
How do I find the leak in my funnel?→
Write the conversion rate you expect on every arrow, then the real rate once you have data. The step where the real rate falls furthest below your expectation is the leak. Fix one step at a time, starting with the one closest to the money, because an improvement there pays off on every visitor who already made it through the earlier steps.
Do I need a funnel mapper to build a funnel?→
No. A funnel mapper plans and measures a funnel; your page builder and email tool build it. Many solo marketers never need more than a free whiteboard and GA4. A paid mapper earns its fee when you present funnels to clients, forecast before spending on ads, or want visitor numbers drawn on the map itself.
FILED ON THE EMAIL, CRM & AUTOMATION SHELF — MORE FIELD-TESTED TOOLS AND GUIDES THERE →
#Funnels#funnel mapping#conversion#solo marketing
Never miss a verdict
One tool tested, one workflow, one future signal, one deal — every week.
One email with the goods, then the weekly letter. Unsubscribe anytime.
Keep reading

Marketing
How to Refresh Old Blog Posts for More Google Traffic (With Search Console)
The fastest traffic a small site can win is sitting in posts you already published. How to find them in Search Console, what to rewrite, and how to re-date honestly.
OCT 2026 · 10 MINREAD →
Marketing
Winning Hunter Review (2026): Pricing, Features and the Fine Print
Winning Hunter is an ad spy for Meta, TikTok and Pinterest with a Shopify store tracker built in. It's well rated and free to try without a card. The catches: the filters that matter start on Standard, and nothing is refundable.
SEP 2026 · 8 MINREAD →